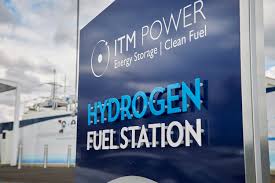
Understanding the type of fuel used in hydrogen fuel cells and hydrogen internal combustion engines (H2-ICE) is crucial, as it influences both performance and the environmental impact of a fleet. The way hydrogen is classified—often by carbon intensity or color codes like green, blue, grey, and pink—helps convey its environmental footprint. Various organizations, including agencies and industries, have adopted these classifications to differentiate hydrogen based on its production methods and associated emissions.
Hydrogen, the universe's most abundant element, must be extracted from sources such as water, methane, and oil, requiring different production methods that have varying energy needs and environmental impacts. The source of hydrogen and its production process can result in emissions like carbon monoxide and carbon dioxide. The cleaner the production method, the lower the overall carbon footprint from production to usage.
To better understand hydrogen's impact on climate change, it's essential to consider both color codes and carbon intensity scores. These tools help industry and government stakeholders develop standards for hydrogen, which has the potential to significantly reduce emissions while meeting the rigorous demands of medium and heavy-duty trucking.
Recognizing differences in hydrogen production through color codes and carbon scores can assist fleets in achieving their environmental, social, and governance (ESG) goals. According to McKinsey & Company, this awareness can also reduce risks and attract investors. Tom Swenson, Director of Global Regulatory Affairs at Cummins Inc., highlights that while color coding is useful, accurate ESG calculations require carbon intensity values.
Isabel Castro, Electrolyzer Marketing Director at Accelera™ by Cummins, also notes the value of color categorization but emphasizes that carbon intensity scores provide a more accurate assessment of hydrogen's true environmental impact.
It's also important to note that hydrogen purity affects performance, particularly in fuel cells, which require much purer fuel than H2-ICE engines. Contaminants can degrade fuel cell performance, making it crucial to adhere to specific hydrogen fuel specifications.
Understanding the different colors of hydrogen is vital for evaluating its environmental impact. For example:
- Green hydrogen is produced through electrolysis powered by renewable energy sources, resulting in zero emissions during production.
- Yellow hydrogen is a type of green hydrogen derived from solar power.
- Grey hydrogen accounts for 95% of hydrogen production in the U.S., typically generated from natural gas, with significant greenhouse gas byproducts.
- Blue hydrogen is similar to grey hydrogen but includes carbon capture and storage (CSS) to reduce emissions.
- Turquoise hydrogen is produced through methane pyrolysis, generating hydrogen and solid carbon without emitting carbon monoxide or dioxide.
- Pink hydrogen is produced through electrolysis powered by nuclear energy.
- Brown and black hydrogen are derived from coal, with black coal being less harmful but still environmentally damaging.
- White hydrogen occurs naturally in underground deposits, sometimes referred to as gold hydrogen when found in depleted oil wells.
With the increasing array of hydrogen colors, some stakeholders find the classifications confusing as they don’t provide a precise ESG metric. Instead, carbon intensity values, as used by organizations like the Department of Energy (DOE) and the California Air Resources Board (CARB), offer a more accurate and standardized way to assess hydrogen’s environmental impact. Hydrogen consistently shows some of the lowest carbon scores among the fuels analyzed by CARB.


 Understanding Hydrogen Fuel: Types, Color Codes, and Environmental Impact


 Companies